A New View on the ESG Impact of Sovereign Debt
ABOUT IMPACT CUBED
Impact Cubed provides analytics and investment solutions for building more sustainable portfolios with greater impact. It combines an award-winning approach to integrating impact into risk and return with technology-enhanced portfolio design and management. The outcome is a seamless approach to customised sustainable investing.
This research report is the work of the Impact Cubed team who developed the sovereign impact model, data and portfolio impact reporting tools: Larry Abele, Libby Bernick, Arleta Majoch, Diana Marosi-McMahon, Henry Marshall, Antti Savilaakso, and Zachary Vlessing.
While developing the sovereign impact model, Impact Cubed engaged with the investment teams at ten asset management firms in Europe and North America with extensive expertise in sovereign and emerging market debt. Their contributions, insights and feedback were invaluable to making this ESG research practical and relevant for fixed income investors. Impact Cubed is grateful for their leadership and support.
You can find out more about our data and portfolio models at www.impact–cubed.com. If you have questions about our ESG data and analytics, we would love to hear from you at info@impact-cubed.com.
EXECUTIVE SUMMARY
Current ESG scoring approaches consistently put wealthy nations at the top of their rankings. These scores value the way countries manage wealth over progress in sustainable development, creating an entrenched wealth bias in fixed income ESG investments. This poses a major problem for investors because it favours lower yielding sovereign fixed income investments in developed markets and pushes financing away from emerging market countries that need it the most.
The Impact Cubed model removes this wealth bias by curating 29 objectively measured factors aligned with the UN Sustainable Development Goals (SDGs) and creating empirical progress pathways for each factor. This approach avoids penalising less-developed countries that may have started at a lower level and uncovers emerging market countries that are moving ahead faster than expected based on global history. The data allows investors to spot higher yield opportunities that also have higher impact and report on how well portfolios are creating impact or aligned to the SDGs.
This dual view on impact, using both the level and progress on a pathway, provides differentiated and more nuanced insights on both emerging and developed market countries where investors can see the difference between countries that are leaders, laggards, catching up, and stalled on their level and pathway.
The goal of this research report was to understand whether applying this new point of view along with a more objective, factor-based approach could provide superior ESG insights on impact for fixed income investors. The results challenge the conventional wisdom about how to integrate ESG performance into sovereign debt.
TOP FINDINGS
- While the European region leads other regions on impact, Eastern Europe and Asia are catching up to Western Europe. The Americas lag Europe, Asia, the Middle East and are on a par with Africa.
- Lithuania tops the impact leaders list, which includes eight emerging market countries among the top 20.
- Many countries favoured by conventional ESG scores, such as Australia, Austria, France, Iceland, Japan, Norway, Sweden, Singapore, and the United States, are not in the top 20 on impact. Many of these countries are actually stalled on as many impact factors as they are leading on.
- Among the top five debt issuing countries, the United States – the largest debt issuer – is at the bottom of the impact list. When we consider factors where countries are both leading and catching up, China is on a par with Germany, and ahead of the United Kingdom, Japan and the United States
- Regional emerging market leaders are Lithuania in Europe, Botswana in Africa, United Arab Emirates in the Middle East, Thailand in Asia, and Dominican Republic in Latin America.
FIGURE 1. WEALTH BIAS OF CONVENTIONAL ESG SCORES (SOURCE: WORLD BANK)
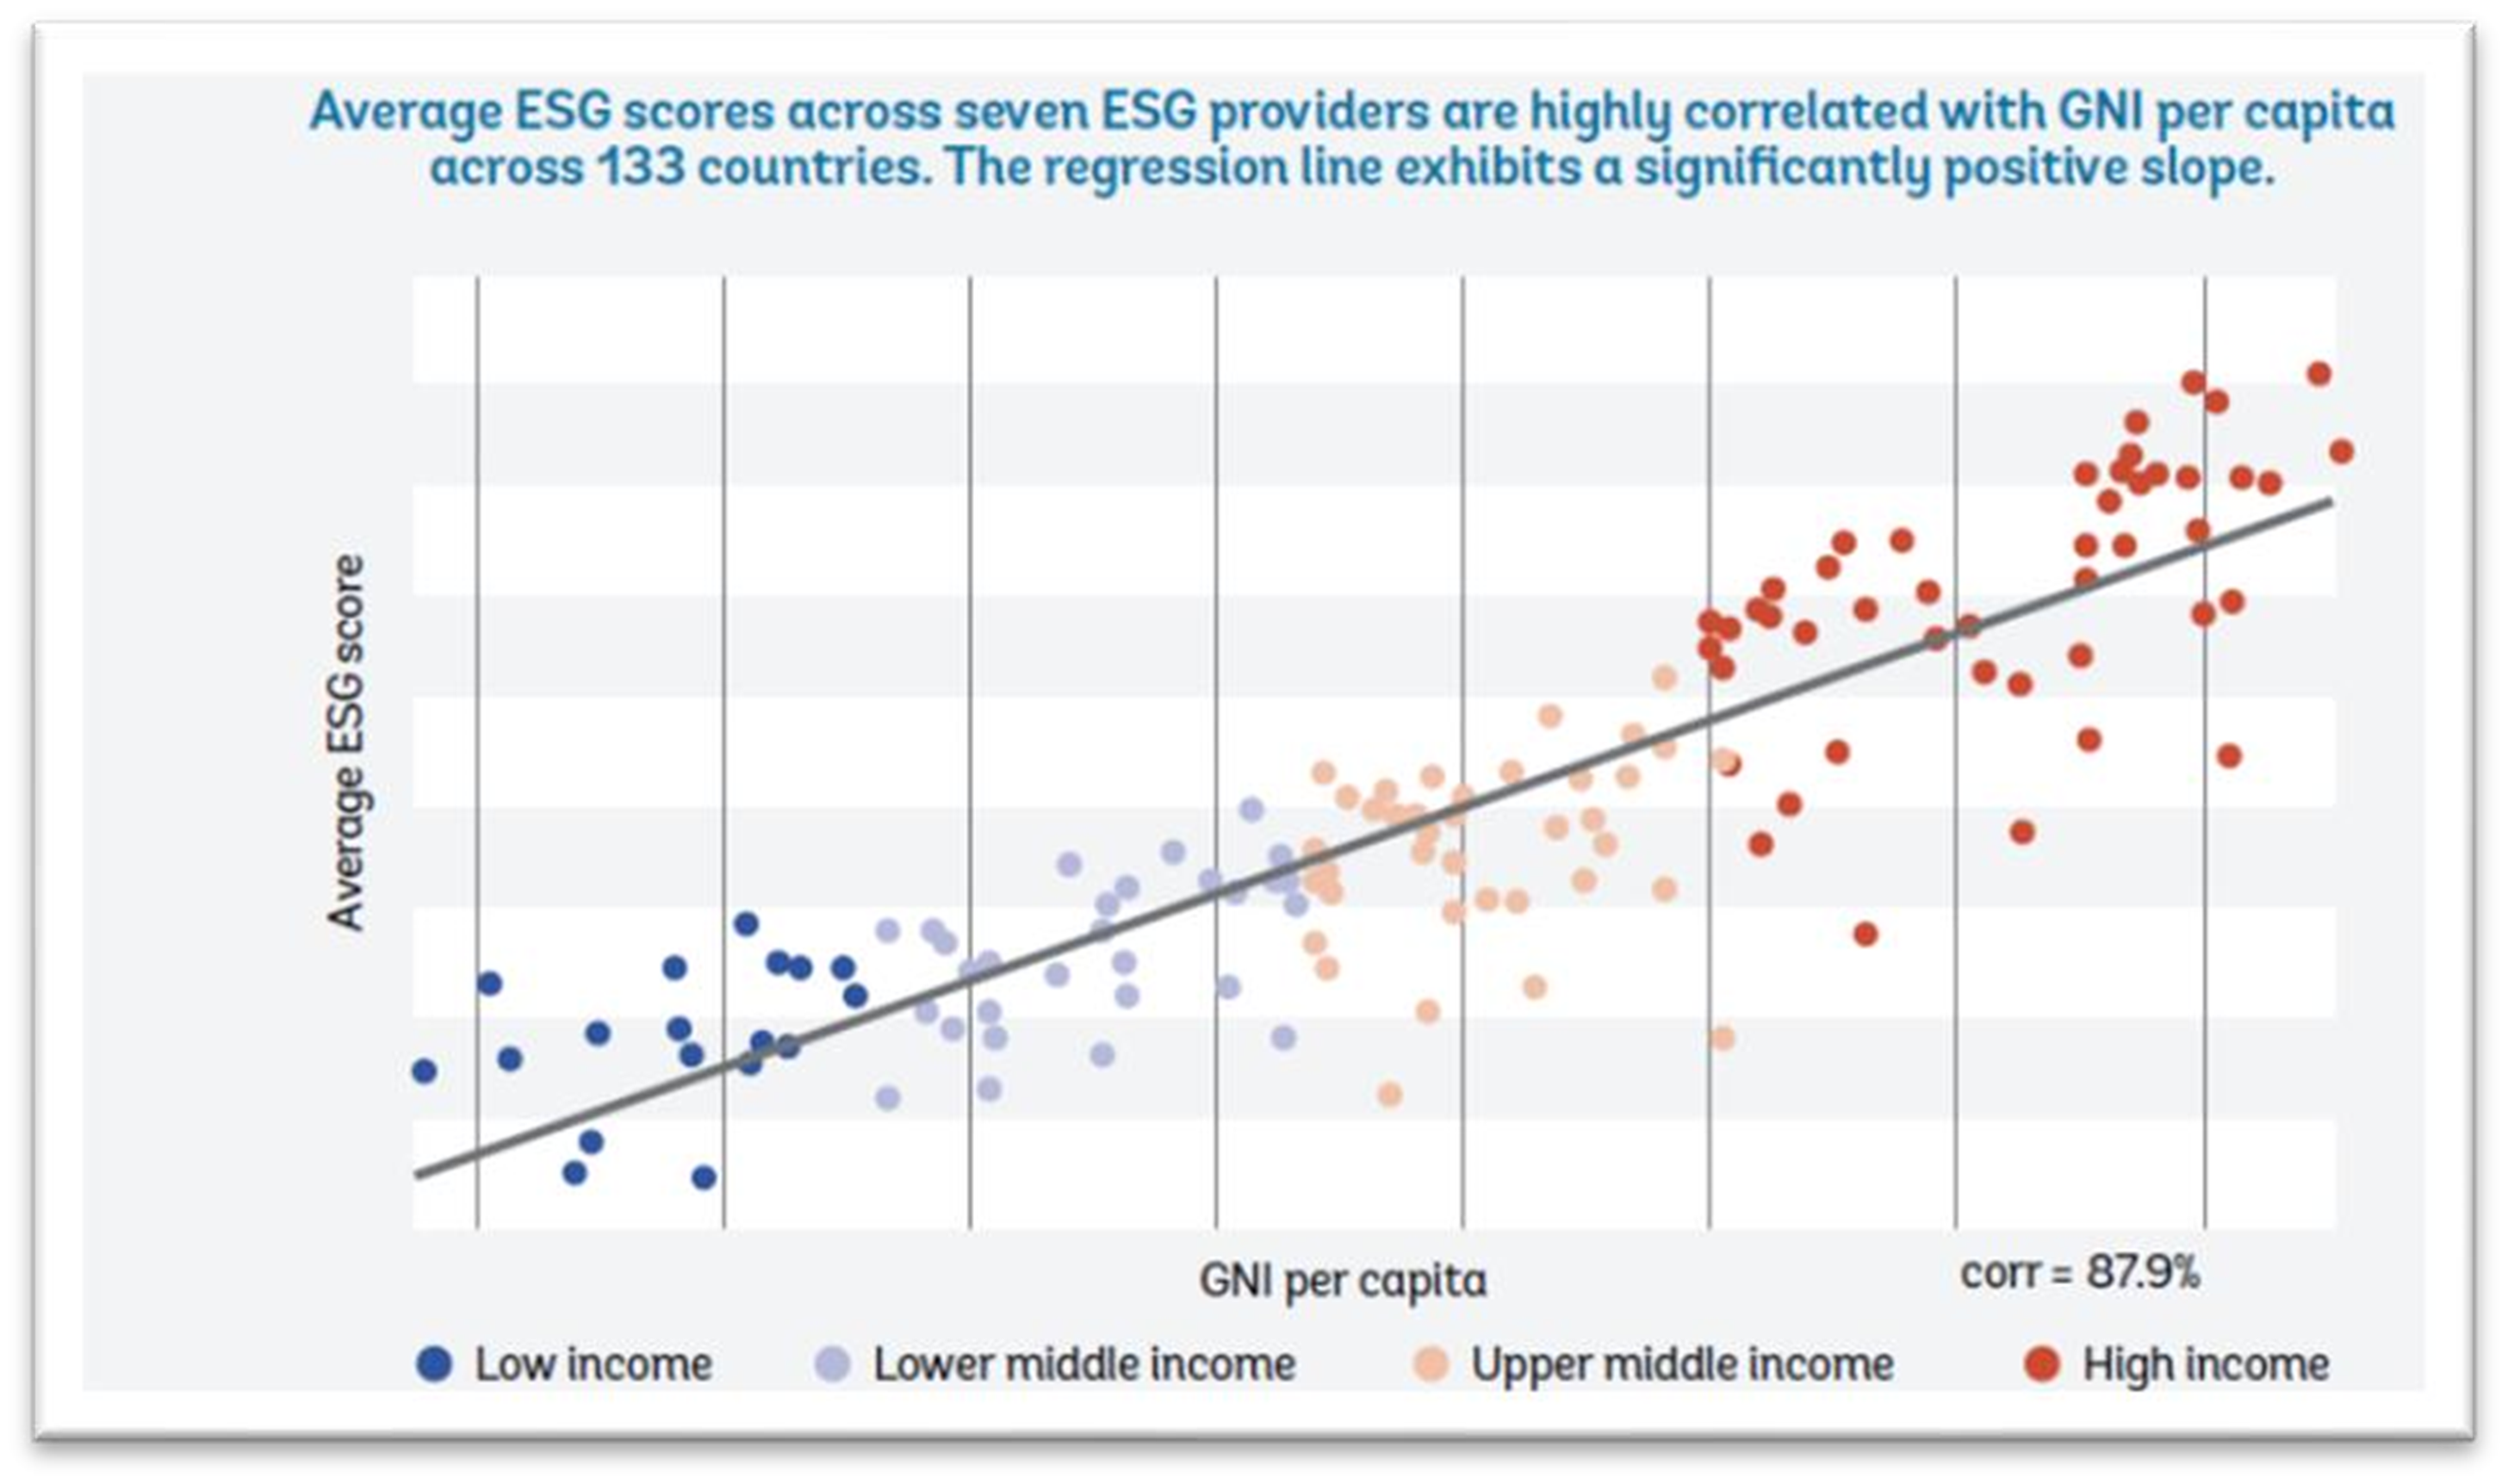
This wealth bias is a dual challenge for investors. Sovereign debt of wealthy countries generates some of the lowest yields, imposing a trade-off between higher ESG scores and financial return. And, if an investor allocates capital to countries with higher ESG scores, it is being diverted away from countries that need it most to achieve a more sustainable economy.
What if ESG analysis was not about how sustainable a country is today but rather whether the country is developing at the rate that is expected based on global history? After all, income level shouldn’t determine whether a country is developing sustainably or not.
To get around this bias, Impact Cubed asked a fundamentally different question than the usual starting point in ESG research: “To what extent are countries contributing to a more sustainable economy?” We then built empirical pathway models, as described in the “Methodology” section, to help investors uncover both the current level of performance and a country’s rate of progress.
The goal of the research was to understand whether applying this new point of view along with a more objective, factor-based approach could provide superior ESG insights on impact for fixed income investors.
METHODOLOGY
Developed in consultation with leading asset managers in Europe and North America between January and May 2021, the Impact Cubed sovereign impact model quantifies countries’ alignment with the SDGs. The model builds on Impact Cubed’s existing corporate equity and debt model, with complete coverage of all global listed equities and sovereign debt, and comparable reporting on impact across all asset classes.4
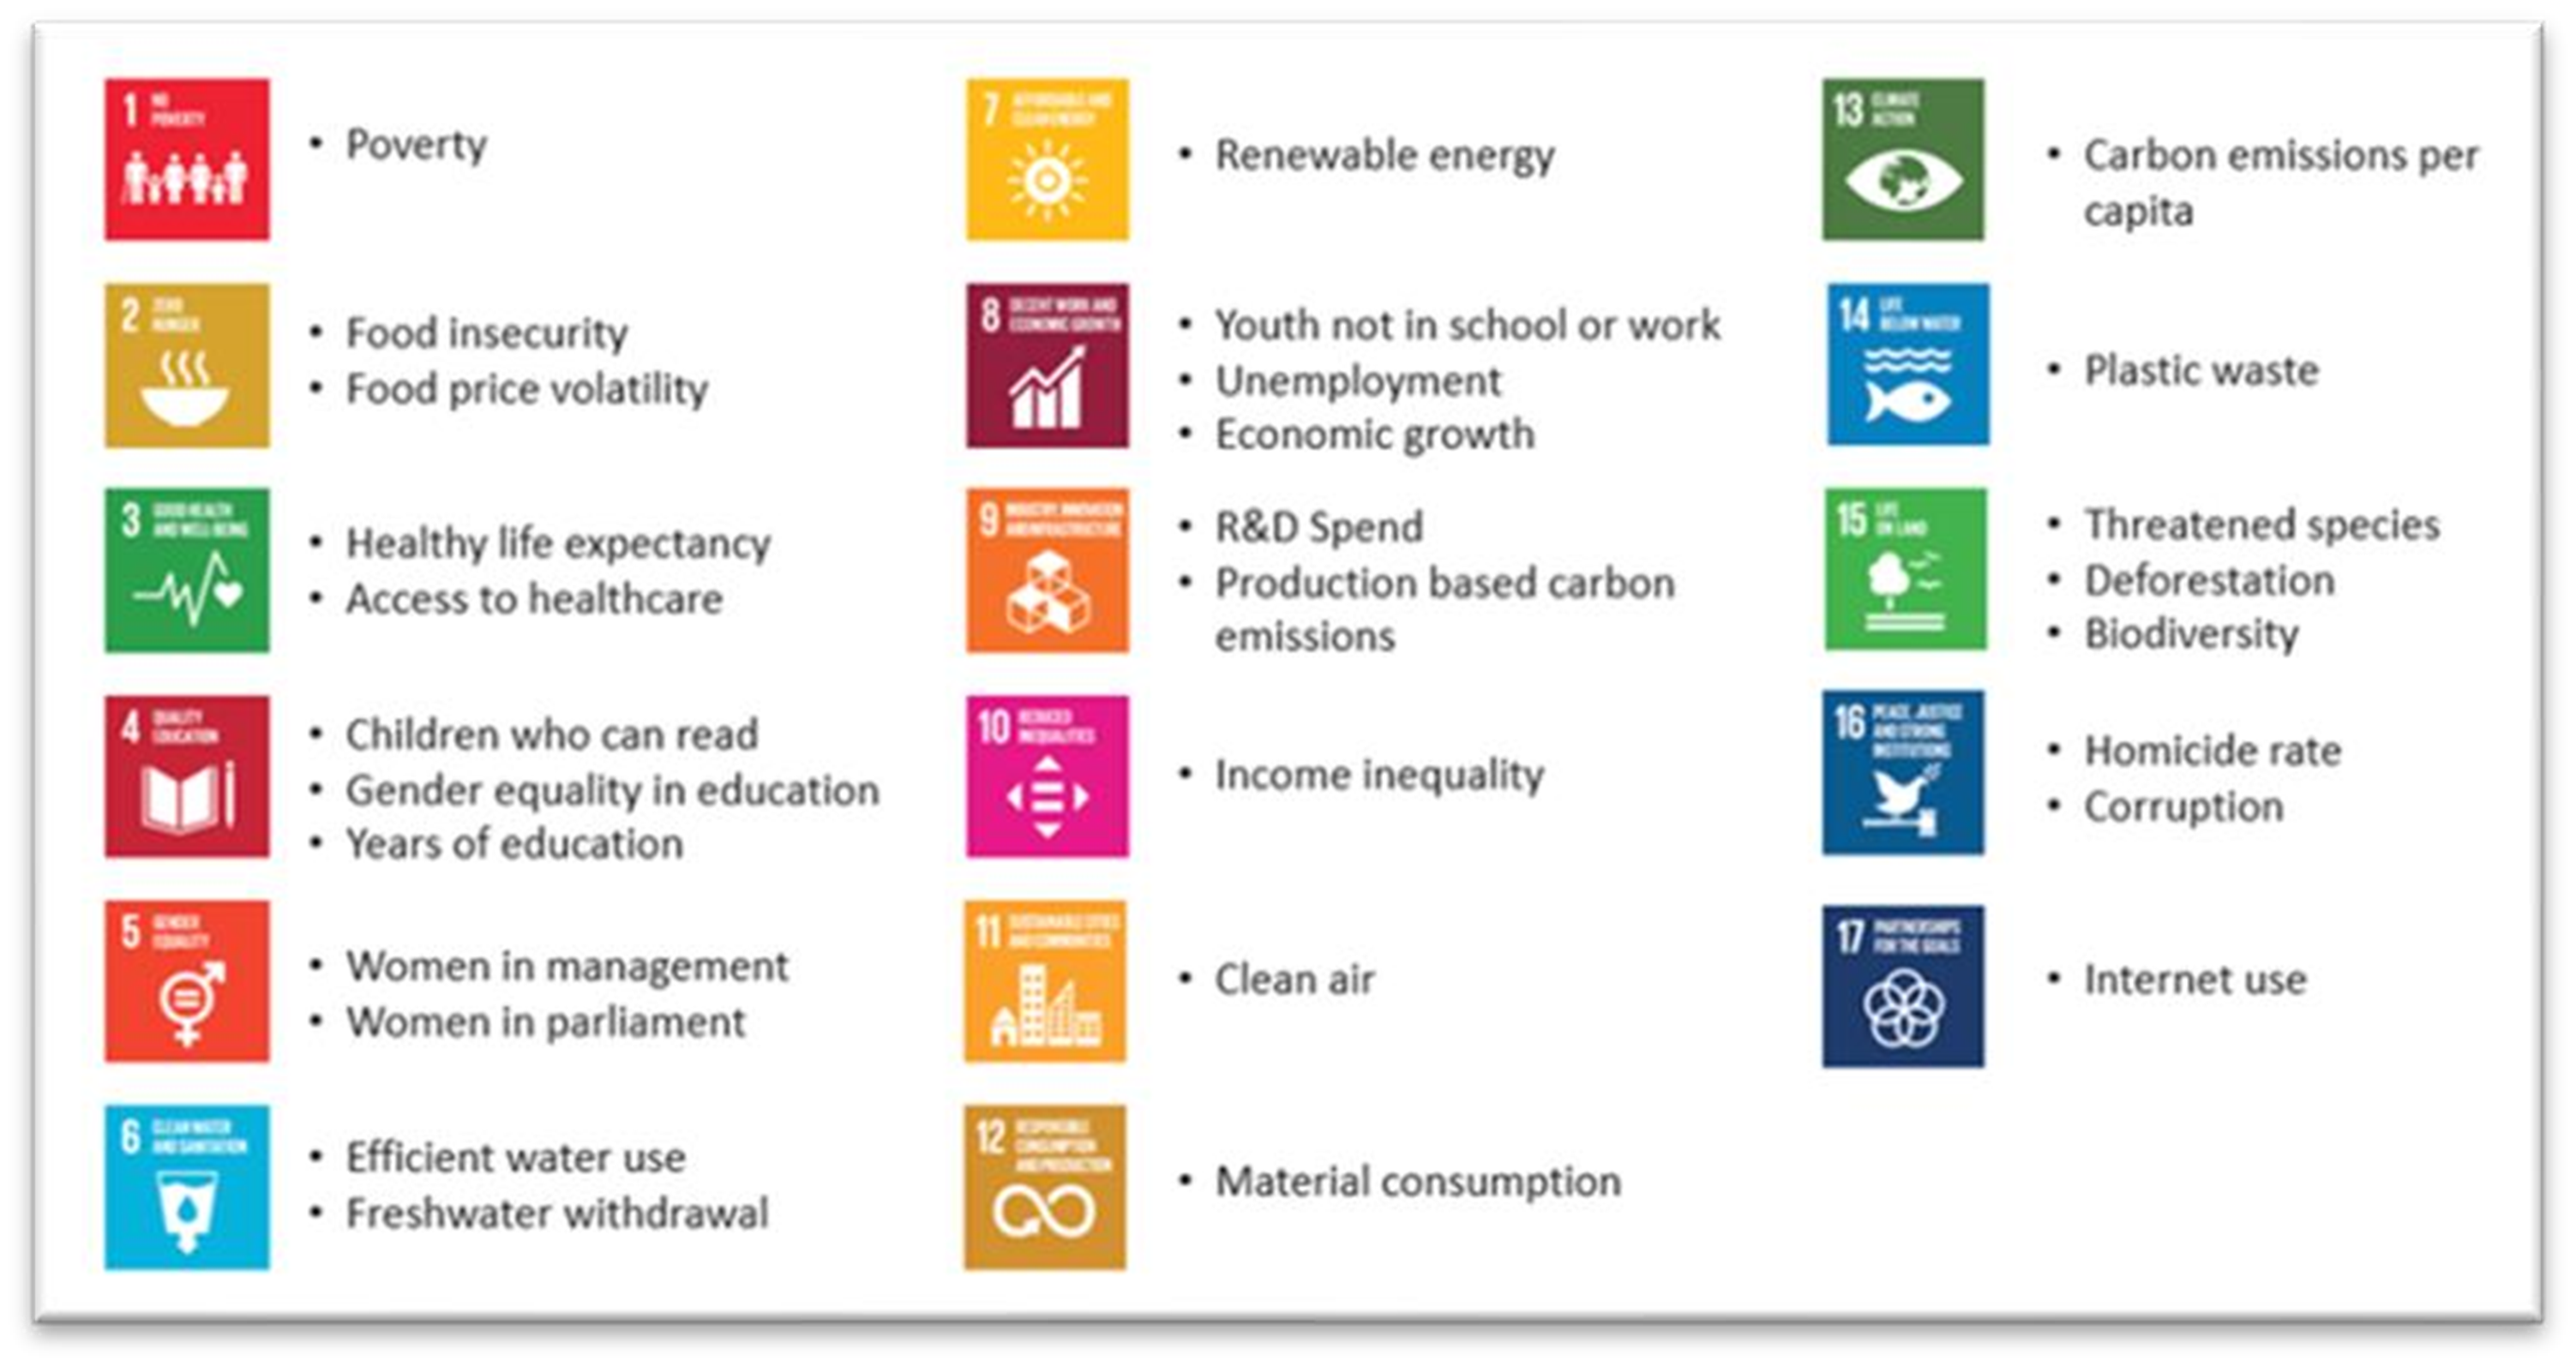
From a potential list of 247 SDG performance measures, Impact Cubed curated a list of 29 factors, removing those that are not outcome-oriented or do not have sufficient quality or quantity of data. These factors, listed in Figure 2, prioritize objectivity and minimise correlation to ensure each factor adds independent value.
FIGURE 2. IMPACT CUBED’S 29 SOVEREIGN DEBT FACTORS
For each of the 29 factors, Impact Cubed gathered relevant data for the past 20 years and created an empirical global pathway analysis to determine the rate at which countries have historically progressed on each factor. The level of performance on each factor was compiled from publicly available data sources maintained by non-governmental organisations including the UN, the World Bank and FAO. The pathway shows a country’s actual rate of progress compared with the expected rate of progress for any given level of performance, which avoids penalising less-developed countries that may have started at a lower level. In any given year, the Impact Cubed model quantifies a country’s current level of performance and its progress on the pathway for each factor.
Higher performance on a pathway means a country is improving faster than expected, while a lower value indicates slower progress. For each factor, we are able to discern the difference between countries that are ahead or behind others on the level of performance and countries that may be at a low level but are shooting ahead much faster than expected based on global history.
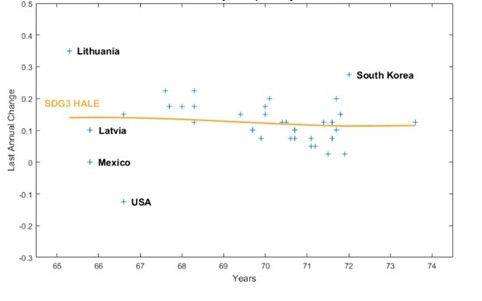
For example, Figure 3 shows with an orange line the global pathway for the health adjusted life expectancy factor (SDG 3). The pathway reveals that, as life expectancy increases, the rate of improvement drops off. While Lithuania and Latvia are at similar levels (i.e. about 65 to 66 years of health adjusted life expectancy), they have very different progress. Lithuania is moving ahead at a positive pace faster than the pathway, while Latvia is moving at a pace slower than expected.
FIGURE 3. HEALTH ADJUSTED LIFE EXPECTANCY (HALE)
This means, for example, that for each factor we can evaluate every country based on both the level and pathway, as shown in Figure 4, in a leader laggard matrix with the median level on the x-axis and the positive or negative progress on the y-axis.
FIGURE 4. HALE LEADERS AND LAGGARDS.
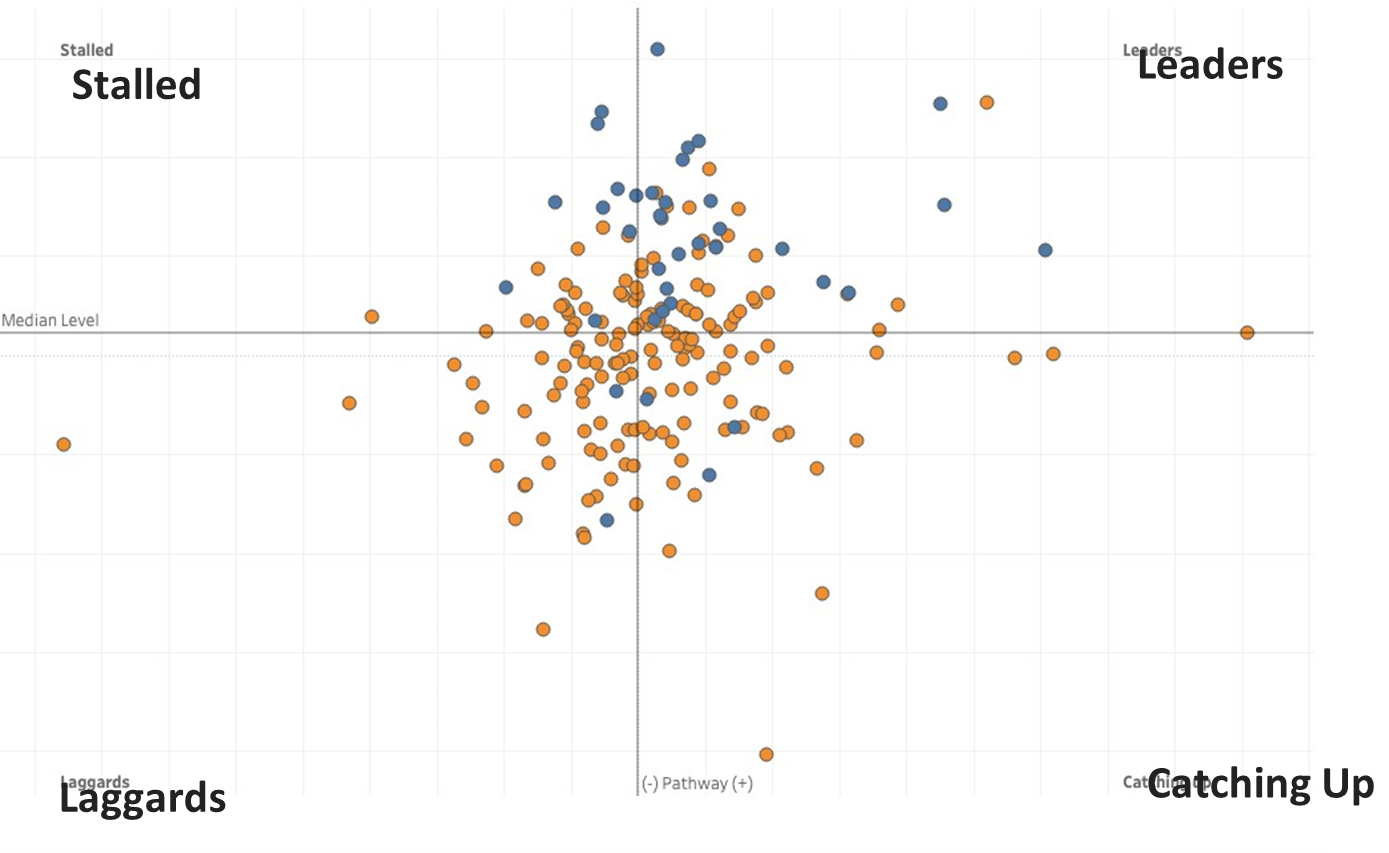
- Countries in the top-right quadrant are leaders; they have an above-average level and a positive pathway (moving faster than expected).
- Countries in the top-left quadrant are stalled; they have an above-average level but a negative pathway (moving slower than expected).
- Countries in the lower left are laggards because they have levels below average and a negative pathway.
- Countries in the lower right are catching up because they have levels below average but are moving ahead faster than expected (positive pathway).
We used this level and pathway data to research the performance of debt-issuing countries on the 29 impact factors. The top findings are summarized in the following section.
RESEARCH FINDINGS
Overall performance on impact
How do higher ESG scoring countries stack up on impact?
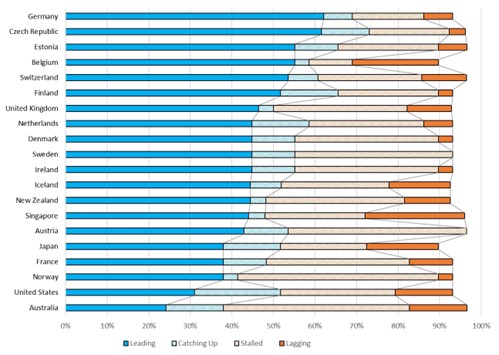
As a first test of the pathway approach, we analysed how the countries with high ESG scores fared on impact. We crowd-sourced a list of the top 20 usual suspects from publicly available country ESG scores of three leading data providers. Figure 5 shows the impact for each country based on the number of times its factors land in one the quadrants (leading, catching up, stalled, or lagging). For example, it shows that Germany is a leader (above average on level and faster progress pathway) on 18 (62%) of 29 factors it reports and stalled (above average on level but slower progress than expected) on only 5 (17%) of them. The first thing that stands out is that using both level and pathway to measure impact shows a much wider dispersion than with conventional country ESG scores. There is almost a 3-fold difference between leaders, ranging from 62% (Germany) down to 24% (Australia). What is most shocking is that many high ESG scoring countries are stalled on almost half of their impact factors, which is a concerning trend suggesting that wealthy countries are stalling on their path towards a sustainable society. For example, the United States is stalled or lagging on more factors than it is leading on. Norway and Austria – top performers on conventional ESG scores – are stalled on as many factors as they are leading on.
FIGURE 5. IMPACT OF TOP ESG SCORING COUNTRIES
How do the top debt issuers stack up on impact?
We next looked at how well the top five debt issuing countries are contributing to a more sustainable society, as shown in Figure 6. There is a large difference between the top and bottom issuers; for example, Germany leads on twice as many factors as the United States.
What is troubling is that the top debt-issuing country, the United States, is at the bottom of the list, suggesting that sovereign debt portfolios overall are not financing progress on the SDGs in the most effective way. China is a surprising standout when we consider factors where countries are leading and catching up; it is on a par with Germany, and ahead of the United Kingdom, Japan and the United States.
FIGURE 6. IMPACT OF TOP DEBT ISSUERS

What countries are leading on impact?
We then turned our view to all debt-issuing countries in our dataset to spot the top performers based on the number of factors where they are in the leader quadrant (above average level and on a positive pathway).
As shown in Figure 7 Lithuania is the top performer, surpassing even Germany with 65% of its factors in the leader quadrant. One possible reason for Lithuania’s high performance is that environmental and economic sustainability issues are a core focus of its National Commission on Sustainable Development, which is chaired by the Prime Minister, and works across the government and private sector to implement its sustainable development strategy.
When we view through an impact lens (instead of the ESG risk lens), we learn that several Eastern European countries and the United Arab Emirates rise up and bump off these usual suspects from the top 20 list: Australia, Austria, France, Iceland, Japan, Norway, Singapore, and the United States.
FIGURE 7. TOP IMPACT LEADERS
What countries are leading and catching up on impact?
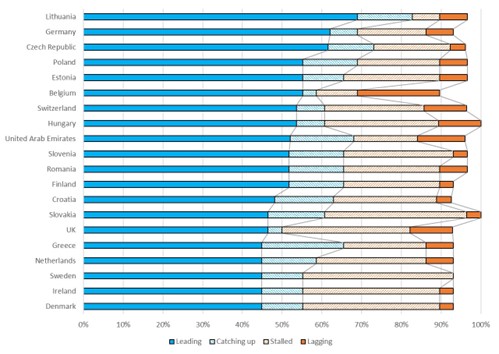
We wanted to see the countries that are leading on more factors and also catching up on more factors (i.e. lower level but faster progress), which are shown in Figure 8. The results are even more striking: only seven countries (Belgium, Czech Republic, Estonia, Finland, Germany, Netherlands, and Switzerland) on the conventional ESG score top 20 list make the cut.
Three emerging market countries, Lithuania, Macedonia, and Poland appear in the top five countries that are contributing to create a more sustainable society when we consider both the current level and pace of change.
FIGURE 8. TOP COUNTRIES LEADING AND CATCHING UP ON IMPACT
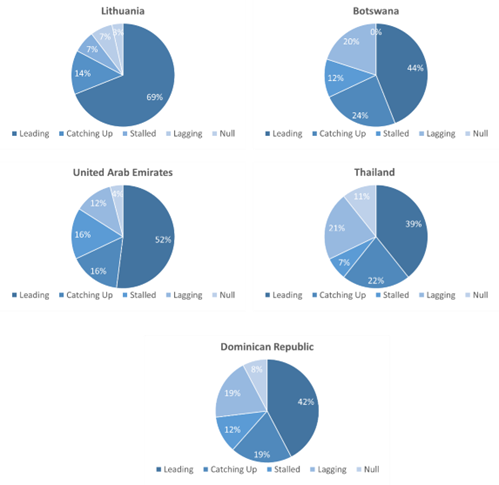
The top emerging market performers in five regions are shown in Figure.
- Africa: Botswana, which is leading or catching up on 17 factors, including strong scores on water sanitation and strong institutions.
- Asia: Thailand, which is leading or catching up on 17 factors. It leads on factors like unemployment and access to healthcare.
- Europe: Lithuania, which has the highest leading score of all countries, including the developed market. It is a leader on 20 factors and has a positive pathway on 78% of factors.
- Middle East: United Arab Emirates, which is leading or catching up on 17 factors. The United Arab Emirates is leading the pack on many economic and social issues in the Middle East including poverty alleviation and gender equality.
- Latin America: Dominican Republic, which is leading or catching up on 16 factors is leading on women representation in parliament and education.
FIGURE 9. REGIONAL EMERGING MARKET LEADERS
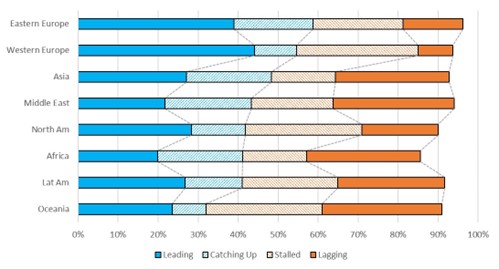
Which regions are doing best on impact?
When we look across all markets in Figure 10, countries in the European regions are the top performers, with Asia a fast follower. What is interesting is that while Western European countries may be at a higher level, the Eastern European countries are catching up faster and are stalled on fewer factors.
Perhaps the most surprising result is for the Americas, with Northern America and Latin America and Africa about on a par despite the big difference in the size of these economies.
FIGURE 10. REGIONS LEADING AND CATCHING UP ON IMPACT
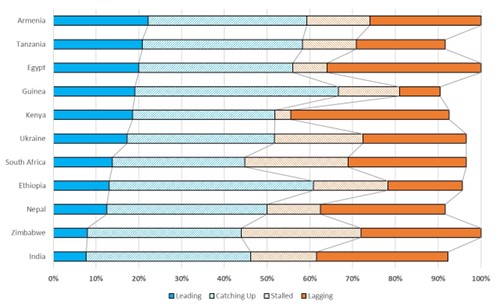
Who are emerging market rising stars?
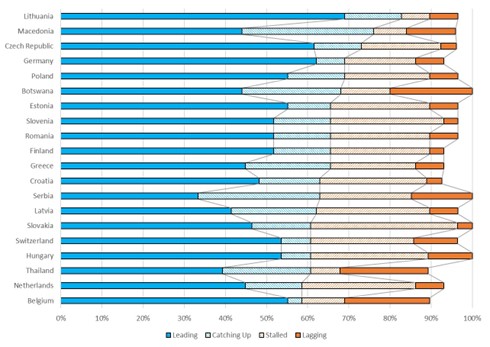
Another question we asked is “who are the rising stars in emerging markets?”, measured by countries with the highest number of factors that are catching up, shown in Figure 11. These emerging market countries (along with those in the laggard quadrant) are among those that need the most investment to meet the SDGs and are leading or catching up on more than 50% of the factors. Countries in Africa and Asia make up most of these rising stars, offering an exciting opportunity for emerging market investors seeking impact.
FIGURE 11. IMPACT EMERGING MARKET RISING STARS
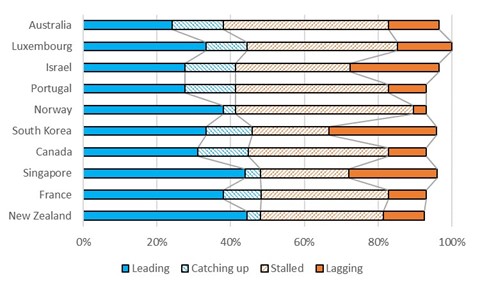
Who are the top underperformers on impact?
The United Nations looks to the developed world to lead the path towards a sustainable future. We wanted to see which countries in developed markets are falling behind their peers, because they signal opportunitieS for sovereign investors to engage with those finance ministers on ESG and impact. Figure 12 shows the top underperformers with negative pathways (stalled or lagging on progress) for over 40% of their factors, with surprising countries like Canada and Norway on this list. Although some of these developed countries may be ahead in minimising their ESG risk, investors should be wary of countries whose trajectory on impact is in the wrong direction. This is a potential warning light that investors can check and see how countries that have made strong public statements (for example on climate policy) have followed through with legislation or meaningful programs.
FIGURE 12. TOP IMPACT UNDERPERFORMERS IN DEVELOPED MARKETS
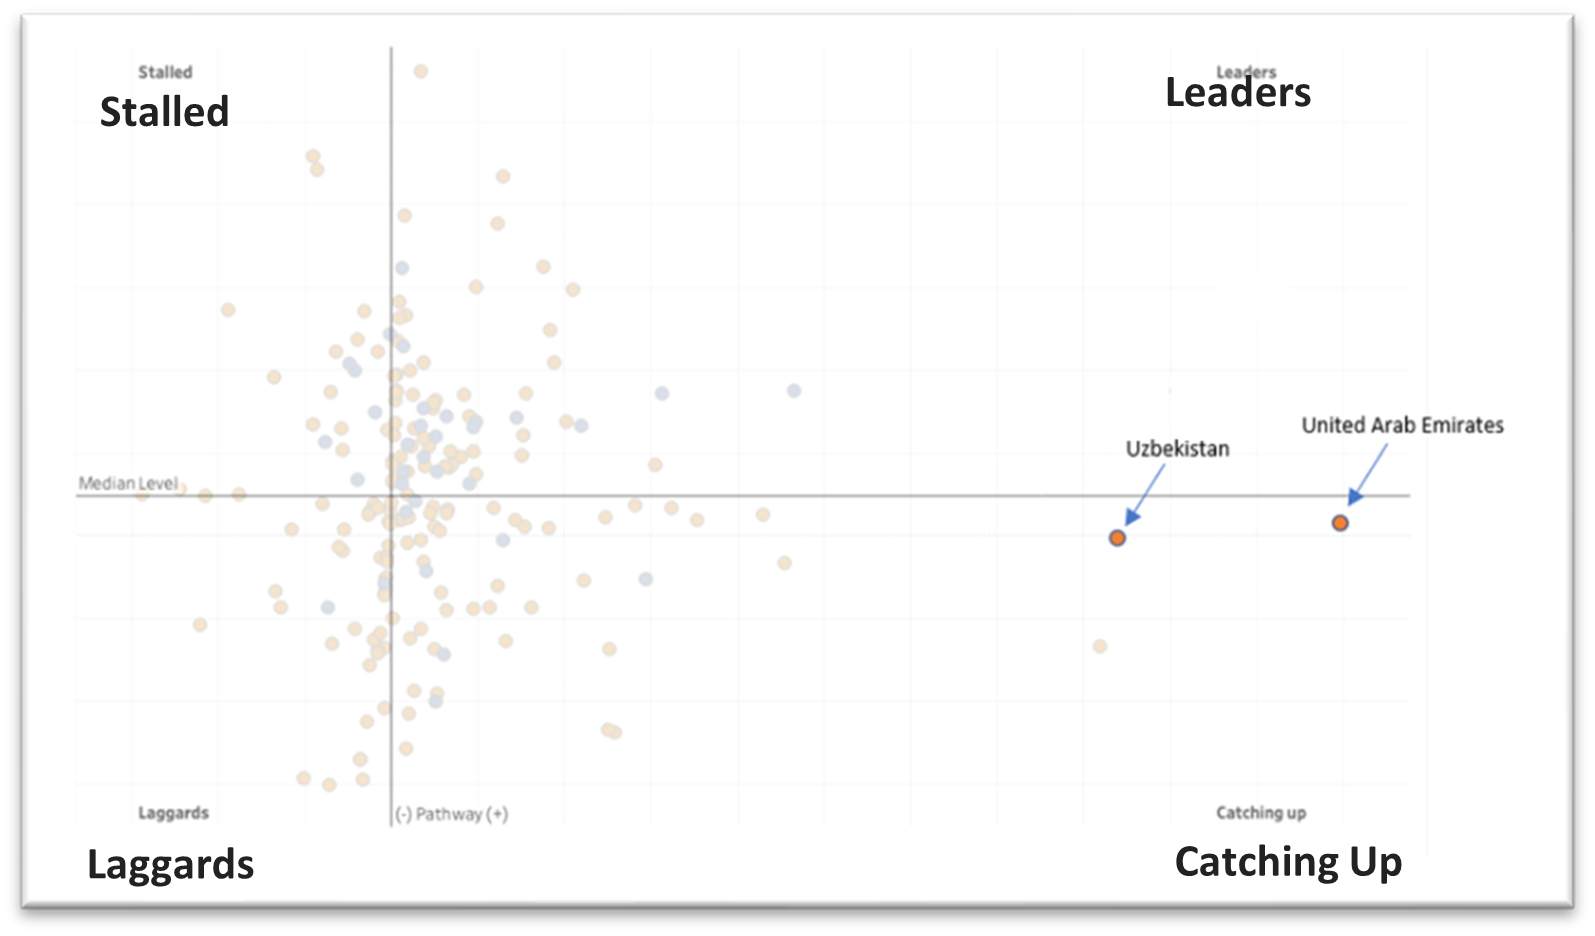
ESG Themes
While we started the research process looking at top overall impact performance, we also decided to take a closer look at a few ESG themes that are of interest to investors: gender equality, health-care, economic development and climate. For this report, we focused on whether the pathway approach could be used to spot outliers – countries that many people would not consider to be leaders but where the data shows there has been significant progress.
Gender equality Gender equality includes three factors: Proportion of women in management, gender parity in education, and proportion of women in parliament. Two emerging market countries stand out in Figure 13. Uzbekistan and the United Arab Emirates. Their level of gender equality is on a par with the world average, but they are progressing much faster than other countries. Recent policy making may explain why. For Uzbekistan, new laws in 2019 provide equal rights and opportunities for women along with legal protections against gender-based discrimination and violence. Following this legislation,200 gender-based violence shelters were created.6,7 The UAE has made significant strides as well, in 2018 issuing a landmark decree to have women represent fifty percent of its Federal National Council members and recently becoming the first country in the Middle East and North Africa to introduce paid parental leave for employees in the private sector.
FIGURE 13. GENDER EQUALITY FACTORS
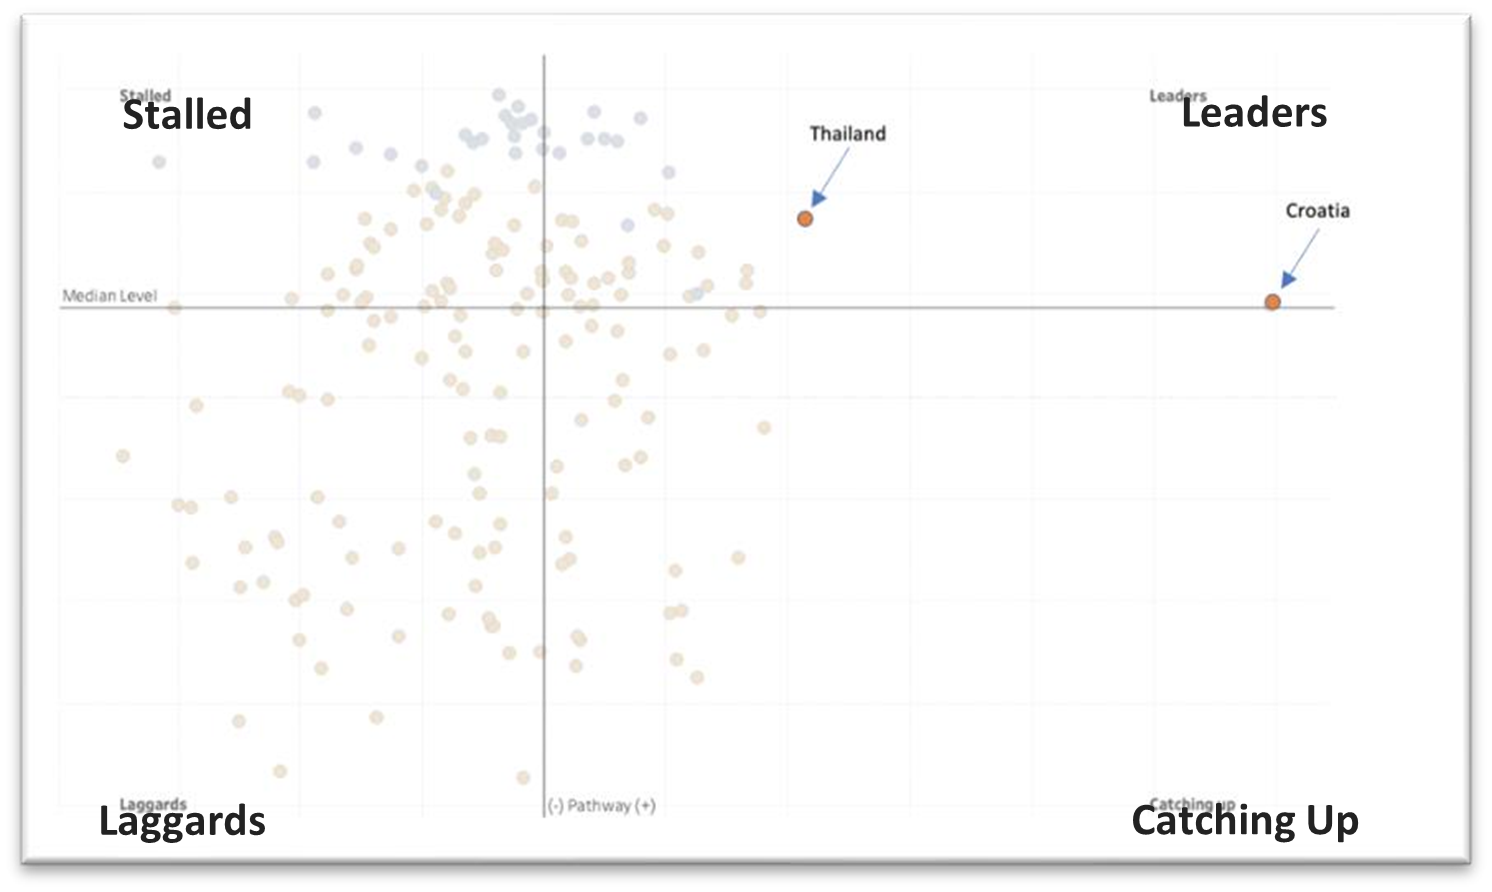
Health-care
Covid-19 tested health-care facilities across the world, and investors have a keen interest in understanding which countries lead. This theme includes two factors: health-care coverage and health adjusted life expectancy at birth. As shown in Figure 14, Croatia and Thailand stand out as pathway leaders. Croatia implemented a very successful National Health Care Strategy policy from 2012 to 2020 that increased access to health-care and prioritise standardisation and policy coverage.9 In Thailand, health authorities passed one of the most comprehensive investments in Asia as a response to Covid-19. The “new normal” system strengthened healthcare facilities and supported effective coordination mechanisms to integrate telehealth into its healthcare system.
FIGURE 14. HEALTH CARE FACTORS
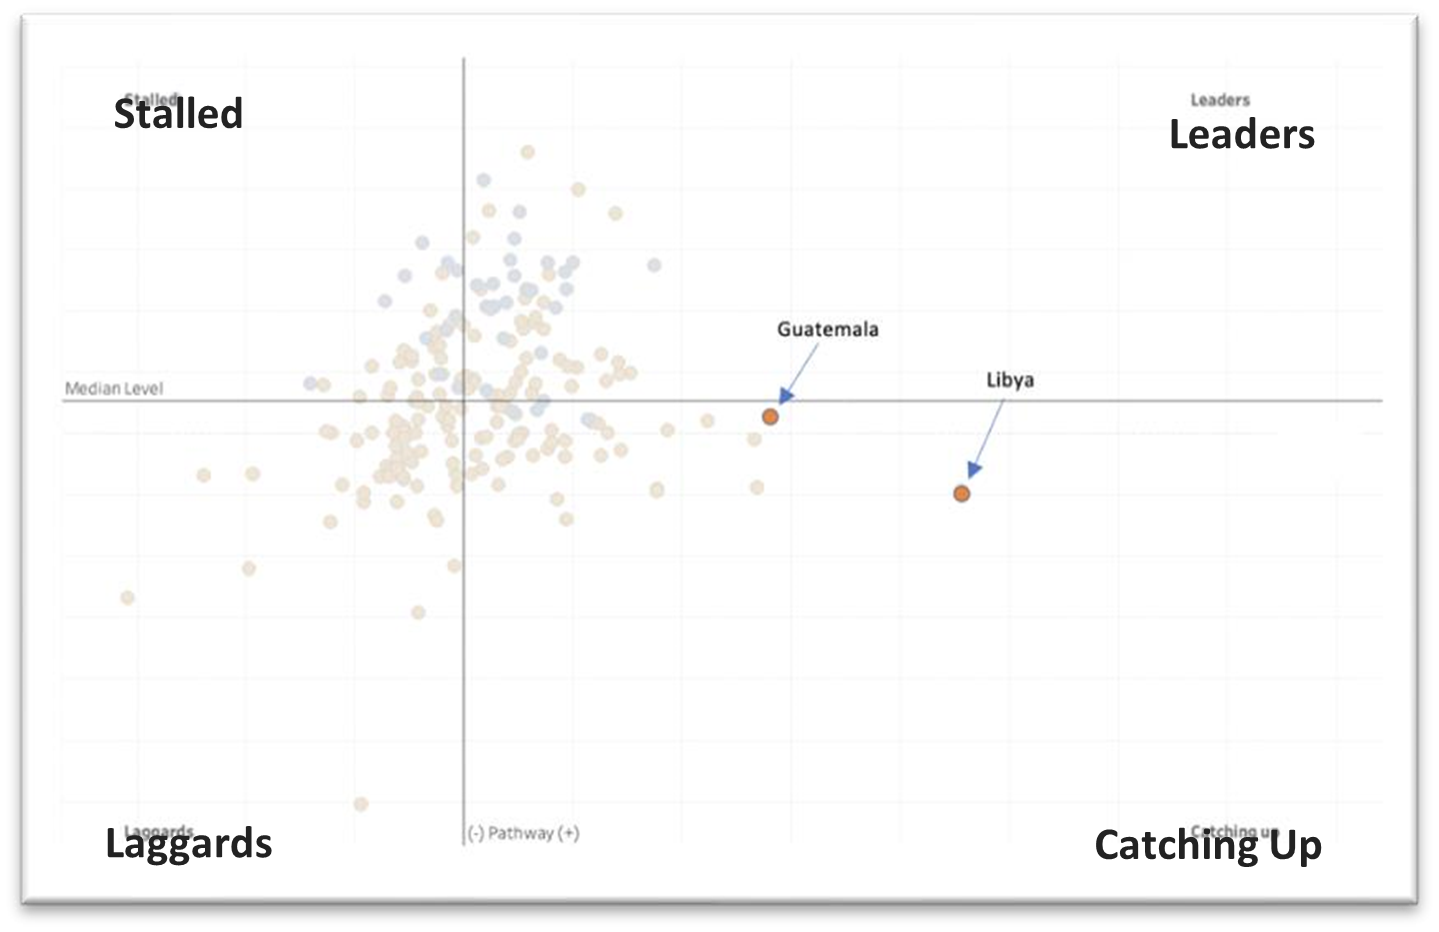
Economic development
Economic development includes five factors: R&D expenditure as percent of GDP, Real GDP Growth per employed person, Unemployment rate, Material Domestic Footprint and Proportion of people using the internet. Figure 15 shows global performance on economic activity. Guatemala and Libya stand out, showing signs of faster than expected progress. In Guatemala, entrepreneurship is growing. As a result of supportive business incentives and government policies like the “Law on Strengthening Entrepreneurship” passed in 2019, Guatemala has a growing start-up ecosystem that is boosting employment and gross domestic product (GDP) growth.11 In Libya, a cease-fire in 2020 has put economic activity back on track. Peace talks resulted in bringing back oil production and unifying the country’s exchange rate, stabilising the currency and paving a path for positive development.
FIGURE 15. ECONOMIC DEVELOPMENT FACTORS
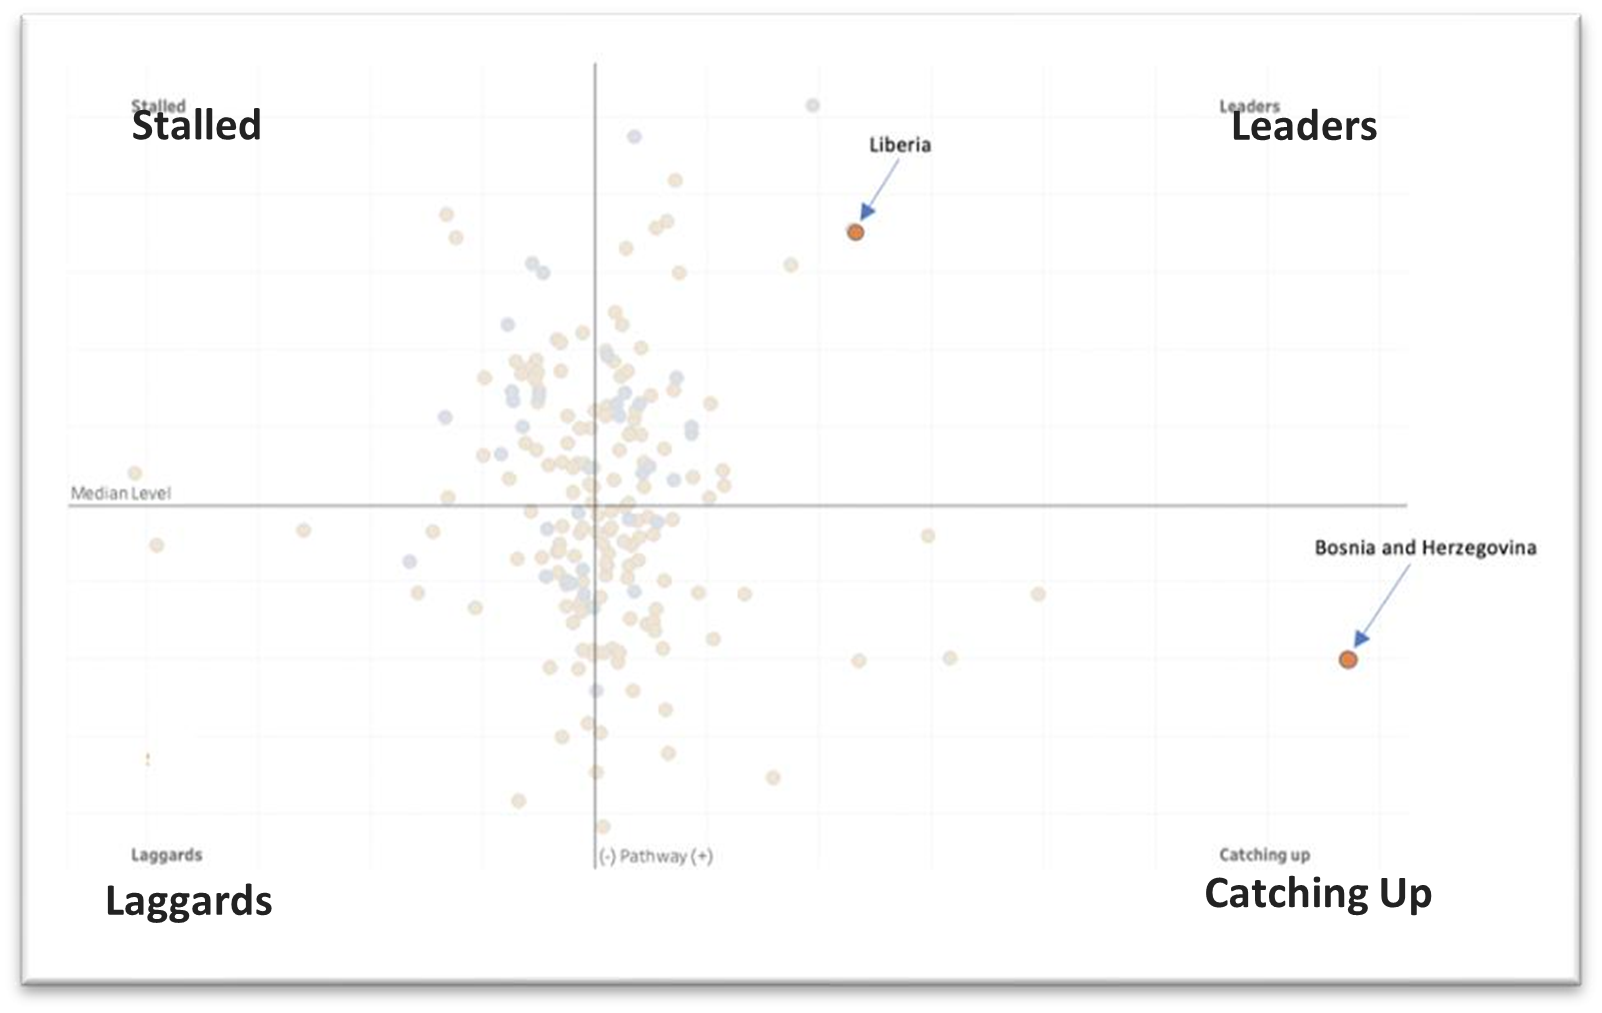
Climate
Investors are increasingly interested in climate change and how countries will make the transition to low-carbon economies. Climate factors include consumption based carbon emissions per capita, carbon consumption per unit of GDP, and share of renewables in energy supply. Figure 16 shows Liberia is a surprising standout and strong leader, with a high level and continued positive progress on climate factors. Liberia has a series of strong renewable development projects, including the development of a large hydropower plant and funding to provide sustainable electricity to over half a million Liberians.13 Bosnia and Herzegovina is also noteworthy, because even though it is at a lower-than-average level, it has one of the fastest rates of progress. In Bosnia and Herzegovina, hydropower accounts for 35% of total electricity production and the last 5 years have seen increasing investment in wind power.
FIGURE 16. CLIMATE FACTORS
CONCLUSION
he results of this research confirm that when you measure sovereign issuer sustainability through an impact focused SDG-aligned lens, the results are quite different from conventional ESG scores. For example, nine of the top 20 countries on impact are in emerging markets. Only two to these, Czech Republic and Estonia, show up in the conventional ESG risk score top 20 list. Adding a measure of progress alongside the level of SDG performance also creates more nuanced results. The leader – laggard matrix (Figure 4) illustrates what can be revealed by measuring countries’ performance on both level and progress. For example, we are able to see a two-fold difference in performance among the top debt-issuing countries. Some top countries may have high performance on many factors, but this research shows their progress has stalled on just as many, if not more. There are several implications for investors who are evaluating the ESG performance of sovereign debt:
Wealth bias is removed
Putting progress on an equal footing with the status quo creates a level playing field, and emerging market countries can compete with wealthier countries. The wealth bias of ESG risk scores makes current data unactionable, as ESG scores are more correlated to income level than to impactful progress.
More objective trade-offs between impact and yield
The pathway allows investors to find high-yield countries that have high ESG impact. Instead of low-yield wealthy nations being placed on top, countries that are improving with a high yield in the emerging markets score just as high on ESG. Removing this ESG-yield trade-off will help speed up mainstream adoption of ESG in the sovereign debt industry.
Financing impact where it’s needed the most
Countries use debt to finance sustainable projects. Investing for impact in sovereign debt has immense potential to create a cycle of positive action, incentivising developing countries to continue their progress. The size of the sovereign debt market creates a clear opportunity for countries to attract investment by creating sustainable development.